It's always really useful to streamline your workflow, so that the processes can be seamless and efficient.
In that regard, I create scenarios for my crowd application that take in Shape files and rasterised GeoTiff files to specify a scenario. The GeoTiff files are obtained by rasterising the shape files using the 'rasterize' tool within QGis.
QGis Rasterize tool
Sometimes, the conversion from vector to raster is not as desired, where some pixel values are a pixel out from where they should be, and therefore, requires some editing. This can be done in Photoshop, however, Photoshop doesn't save the geodata from the GeoTiff file. A tool such as FWTools is needed in order to extract the geographical metadata before editing, and then appending it to the edited Tiff file. For completeness, here is what needs to be done, within the FWTools shell.
Extract the metadata:
C:\> listgeo -no_norm original.tif > metadata.geo
Once edited, copy the metadata to the edited tiff file:
This process becomes pretty tedious over time. A better solution is needed.
Set up the QGis environment within Matlab
Underneath the hood, QGis uses the Gdal library. Python scripts can be written within QGis to streamline the process, however, it's not possible to edit the GeoTiff file within QGis. Therefore, it would then require me to use the FWTools method, as described above.
On the other hand, Matlab already has a GeoTiff reader and writer that we can use to edit the GeoTiff file if required after converting the Shape file to GeoTiff. A simple way to do this is to write a script to first set up the QGis environment within Matlab, as follows:
Now, any QGis functions can be called using Matlab's symbol for calling system functions ('!').
Write a Matlab script to use QGis functions
After setting up the QGis environment, we can now call the QGis functions from within Matlab. We may also want to pass user input to the QGis functions. In order to convert the user input into a Matlab expression that is passed to QGis, we can use the 'eval' function of Matlab
Here, the user input for 'layer', 'input' and 'output' is passed onto the QGis 'gdal_rasterize' function. The code is below:
 % [img, R, info] = rasterise(layer, input, output)
 %
 % This function takes a layer and shape file as input
 %
 % It outputs a GeoTiff file using the GET attribute set in the shape file
 % The GET attribute is specified in the scenario specification work flow
 % document
 %
 % The function also optionally reads the image data into img, the spatial
 % referencing object into R, and the geotiff info into info

 function [img, R, info] = rasteriseShp(layer, input, output)

 % Call the QGis Tools Environment setup script for this session
 QGisToolsSetup

 eval(['!gdal_rasterize -a GET -tr 1.0 1.0 -l ' layer ' "' input '" "' output '"']);

 [img, R] = geotiffread(output);
 info = geotiffinfo(output);

 end
I can now edit the 'img' data matrix if necessary, and write it out using Matlab's own 'geotiffwrite' function, that would retain the geographical metadata.
geotiffwrite('output.tif', img, R);
Similarly, this process can be used for any QGis function within Matlab once the environment is setup. I am also using QGis functions instead of FWTools functions now, as QGis has a later version of 'gdal_rasterize' that I needed.
Whilst we are on the topic of setting up environments within Matlab, a quick mention that FWTools can also be set up and used within Matlab in a similar way. An example set up code can be found here, and I will repeat it below for the latest version:
 % Hamish & Cerys, 9 May 2008
 % This script is public domain code
 % setup environment for FWTools

 FWTOOLS_DIR='C:\Program Files (x86)\FWTools2.4.7';
 setenv('FWTOOLS_DIR', FWTOOLS_DIR);
 setenv('PATH', [FWTOOLS_DIR '\bin;' FWTOOLS_DIR '\python;' getenv('PATH')]);
 setenv('PYTHONPATH', [FWTOOLS_DIR '\pymod']);
 setenv('PROJ_LIB', [FWTOOLS_DIR '\proj_lib']);
 setenv('GEOTIFF_CSV', [FWTOOLS_DIR '\data']);
 setenv('GDAL_DATA', [FWTOOLS_DIR '\data']);
 setenv('GDAL_DRIVER_PATH', [FWTOOLS_DIR '\gdal_plugins']);
P.S If you need an easy way to format source code within blogger, you can find a link to a good source code formatter here.
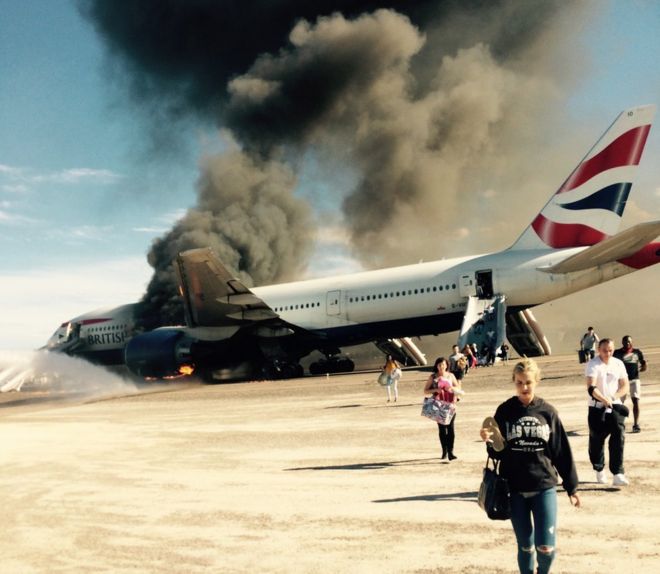
Yesterday, a British Airways flight 2276 from Las Vegas to London Gatwick had one of it's engines catch fire at take off.
During an evacuation of an aircraft, there are few a simple rules to follow. Look for the emergency exits, lights strips on the aisle guide you to it, and walk to the exit to evacuate, leaving all personal belongings behind.
They are made as simple as possible due to the panic and stress that can be induced during the emergency.
The light strips were actually introduced, after a British AirTours Flight 28M air craft caught fire, where 54
passengers lost their lives due to the smoke in the cabin, and many
passengers crawling in the wrong direction. As smoke rises, the ground
level is the last part of the cabin to fill up with smoke, so the light
strips help you to the exits.
Flight 28M caught fire during take-off after a loud thump was heard during take-off. Any similarities to this Flight 2276, where the captain told NBC "There was a loud bang and the aircraft sort of veered to the left..." ? You see where I'm going with this.
Passenger Evacuation Behaviour
Lets first look at the behaviour of passengers, by just looking at one dramatic photo. We see a number of passengers evacuating with their hand bags, luggage, and so on. This goes in contrast to the instructions provided in the event of an emergency.
This one image has created a significant amount of anger over social media, denouncing these passengers as selfish, and valuing their own personal belongings over other people's lives. However, some passengers (not necessarily the ones on this aircraft) argue that they would take their personal belongings for
all sorts of reasons, business, medication, they had it on their lap
(such as their laptops), and so on, maintaining that they don't see a problem with it if they already have it on them. As can be seen from some of the comments in this BBC news article.
Comments I keep all my most important items in my carry-on bag. It would be
extremely damaging to my business if I lost it. So yes, I would TRY to
get my bag off the plane as I was leaving -- but ONLY IF it was possible
to do so without blocking anyone else or otherwise impeding the
evacuation.
My hand luggage usually contains my medication, my girlfriend has her
inhaler in hers. Leaving either behind could cause a further medical
emergency.
Damn right I would take my hand luggage. My passport would be in there,
all my contacts and insurance documents too. Without which I'm stuffed
and potentially trapped if the plane burns to a crisp. At school, we were told that in the event of a fire drill we should
leave all belongings on the desk and proceed to the fire exit. With that
said, if I was physically using my laptop at the time, why wouldn't I
would take it with me? If it doesn't slow you down or put yourself or
others at risk, why not grab your hand luggage?
Dangerous Behaviour?
Lets take these two contrasting views into account, and start breaking
it down to the reasons why this sort of behaviour may or may not be a
danger.
First of all, fire spreads, and spreads fast. Several examples can be found where fire, initially small has spread incredibly fast without warning, in nature, wild fires are a good example, but house fires, and fires in confined spaces such as night clubs and train stations also spread fast. Similarly, aircraft cabins are prime venues for fire to spread quickly, or atleast for it to be engulfed with smoke much much quicker than if the venue is not contained. The smoke can have the ability to incapacitate rapidly, impair judgement and vision.
Therefore, there is generally a rule for aircraft evacuation, where the aircraft crew has 90 seconds to evacuate all passengers including themselves. The light strips along the aisle will guide passengers towards the exit, and passengers to leave without any belongings. Delaying the evacuation reduces the chances of survival.
Secondly, in regards to passengers who do not see a problem with carrying belongings they have on their laps, such as a laptop. That is an object that can be dropped on the floor, especially in the panic. In addition, if the smoke has impaired judgement and caused confusion, objects like these, as well as purses, handbags, can cause obstructions and congestion. There was an experiment I took part in, as part of the BBC's 'Bang goes the theory' series where, a participant exited a simulated evacuation with her handbag, and actually got stuck. This is another example of how personal belongings can cause a problem.
Thirdly, this is specific to an aircraft evacuation. When a passenger wears heels, spectacles, bags that have sharp corners, and so on, can actually cause tears in the slide, and in turn, restrict the use of that particular exit, which puts other passengers in grave danger.
Finally, if the smoke and fire suddenly becomes intense, all passengers will want to evacuate immediately, increasing pressure and density towards the exit. This situation can lead to crushing, and personal belongings are likely to be dropped and cause further injuries.
However, if passengers have already got personal belongings on them whilst exiting, it is best to let them continue to do so, as asking them to leave belongings behind can actually make the evacuation less orderly, as an Australian Safety Trasportation Board reported in 2001.
Here is a video of a simulation of a couple of scenarios where we can observe how quickly smoke and fire can spread within a cabin, and the effect of the slowdown it has on the passengers caught up in that area where it's most intense. These are scenarios with passengers without any personal belongings.
Whether the behaviour is selfish in and of itself, it is normal human behaviour to think about your own belongings that you hold dear in the event of an emergency especially as one is in a confused and stressed state, in addition to not thinking clearly as to how life-threatening the danger actually is. Nobody knows how they will behave in an emergency situation. Therefore, during such a situation, it is best to listen to the crew that are in control and to trust them above your own individual instincts, as they have had the specific training to handle such situations. Primarily based on research and historical incidents.
It is a system issue here, and in order to counter instinctive human behaviour, there may be changes that may be necessary to be implemented, but as so often is the case, it will possibly only happen if an actual disaster takes place due to this type of behaviour.
The GeoData Abstraction Library is a very popular library for converting and processing raster and vector data. It is used by popular GIS software such as the open source QGis, and can be used in proprietary software such as Esri's ArcGis. It can also be used within your own application to import and work with vector and raster data in different formats.
GDAL supports over 200 raster and vector formats, as well as provides tools and utilities for processing the data being imported, by reading / writing, transforming, converting, and so on. This makes it a very powerful and flexible tool for manipulating such data in one's application. One such example, specific to a crowd simulation software, is the ability to import geo-referenced real-world maps as raster (eg, geotiff files) and vectors (eg, shape files) in order to map the crowd based on real-world urban maps in the application. In the case of a grid based crowd model, the cell values in the raster data can be used to define the walkable areas for the agents. On the other hand, vector data can be used to provide the location of walls for an Agent Based Model.
That is an aside, coming back to GDAL, it is a library that can be used from a stand-alone command-line terminal, or it can be incorporated into one's own software for handling and manipulating georeferenced data by the software itself. In order to use GDAL into one's own software application, it's web page provides many tutorials on importing GDAL, however, the tutorials and files are split into several different parts, and it can be difficult to get to grips with obtaining the correct compiled libraries for use within your application. Alternatively, we can also build the library directly from the source files. For those who want to obtain the correct files and use it in your application, I thought it may come in handy to use obtain and use it using an example, so here are the steps for building GDAL as well as obtaining the compiled source files directly, and including the correct header and library files in an application.
Option 1: Building the files from source - latest version 2.0.0
This option requires you to build the files yourself, but thankfully it's a fairly easy process. You can download the latest source files as a zip file from the GDAL website by going to the 'Building GDAL from Source' link, and clicking on 'Download from source', alternatively, by clicking here.I downloaded version 2.0.0's zip file. Now in order to build from source, we follow the steps below:
Extract the downloaded source zip files to a convenient location, as a working example, I'll use 'C:\gdal200'.
Open your Visual Studio Developer command prompt. For Visual 2013, it's called 'Developer Command Prompt for VS2013', and will be of a similar name for previous versions of VS Studio.
Type 'vcvars32.bat' and press Enter, in order to set up the
appropriate environment variables. Note: for 64-bit builds, the
instructions are slightly different. Refer the 'Building from Source' section here.
Change the directory to the GDAL folder, eg by typing 'cd C:\gdal200\gdal-2.0.0' and
enter. You can copy the folder location by opening it in Windows Explorer and copying the text in the
location bar if you don't want to type it all.
To set the location of the resulting library and header files, you can optionally edit 'nmake.opt' in the gdal folder, and set 'GDAL_HOME' to an appropriate location, eg 'C:\gdal200\gdal-2.0.0\bld', or leave it as default at "C:\warmerda\bld"
Type 'nmake /f makefile.vc' and press Enter. Wait around 5 to 10 mins for it to finish building.
Type 'nmake /f makefile.vc devinstall' and press Enter. Wait for it to finish.
We are all done, we've built from source and have obtained the lib and dll files for GDAL i.e . 'gdal_i.lib' and 'gdal200.dll' in the 'C:\gdal200\gdal-2.0.0' folder. Note: The dll version name willl defer depending on the version you are compiling.
The include and lib folders will be in the GDAL_HOME location, eg in 'C:gdal200\gdal-2.0.0\bld'.
Now, we have our library and header files, we can skip to the section on using GDAL in Visual Studio.
Option 2: Obtaining the compiled header and library files - version 1.11.1
Alternatively, GISInternals maintain compiled header and library files for use in your application. We can download compiled header and library files from the GISInternals website. We need to be aware of two things:
Deciding what type of build we want, i.e. development, stable or
release. These are basically different branches in the repository. In my opinion, it would be
best to choose the release version, as it is the most stable of the
three branches and can be used in production code. Heading to the
'Stable Releases' link, we find several more options, as I'm building a 32 bit
version, I head to the 'release-1800-gdal-1-11-1-mapserver-6-4-1' in order to download the appropriate files. Here, we download the 'Compiled binaries in a single .zip package' (release-1800-gdal-1-11-1-mapserver-6-4-1.zip) and 'Compiled libraries and headers' (release-1800-gdal-1-11-1-mapserver-6-4-1-libs.zip) in order to include GDAL in Visual Studio.
In terms of selecting the appropriate Visual Studio Version that you are using, it also depends on the type of application you are building i.e a 32-bit or 64-bit one
(this doesn't depend on the bit version of your Visual Studio IDE).
Now that we have downloaded the binaries, libraries and headers:
Extract the compiled binary files to an appropriate location, as a working example, I'll use 'C:\release-1800-gdal-1-11-1-mapserver-6-4-1'
Extract the compiled library files to the root folder of the binary files, i.e. the folder above.
Now, we have the 'gdal_i.lib' in ''C:\release-1800-gdal-1-11-1-mapserver-6-4-1\lib' folder, and 'gdal111.dll' in ''C:\release-1800-gdal-1-11-1-mapserver-6-4-1\bin' folder
First of all, lets look at the final folder structure for the above two options, they're quite different Option 1: The library built from source - version 2.0.0.
Folder structure for gdal built from source
Option 2: The library downloaded from GISInternals - version 1.11.1
Folder structure for gdal obtained from GISInternals
Using the GDAL library within Visual Studio
For completeness, to use the GDAL library within Visual Studio, we need to follow these steps:
1. Include GDAL's 'include' and 'lib' directories that we extracted above in the Project - Properties - VC++ Directories, i.e. Add GDAL's 'include' folder, in the 'Include Directories' path, and the 'libs' folder in the 'Library Directories' path.
Option 1:The library built from source - version 2.0.0.
Include and Library paths for gdal built from source
Option 2: The library downloaded from GISInternals - version 1.11.1
Include and Library paths for gdal obtained form GISInternals
2. Go to
Project - Properties - Linker - Input - Additional
Dependencies. Add the full path of the 'gdal_i.lib' file here, eg:
'C:\release-1800-dev\gdal\gdal_i.lib'
Option 1:The library built from source - version 2.0.0.
Adding gdal_i.lib file in the linker
Option 2: The library downloaded from GISInternals - version 1.11.1
Adding gdal_i.lib file in the linker
3. Copy the 'gdal200.dll' or 'gdal111.dll' file (depending on the version obtained) to the root ofyour Visual Studio solution folder, where the 'dll's' of other libraries are normally copied to.
You should now be up and running with GDAL in your application, and be free to start with the GDAL API tutorials within your application, as found here.
Wembley Stadium. It has a proud history, some may say. It sure is an occasion, to go to Wembley for any event, but of all events, the FA cup final is probably the biggest event on the Wembley Stadium Calendar.
As fans travel to the Stadium from all across the country, the majority arrive at Wembley Park Station, making their way along Wembley Way, as it's traditionally called by fans. The official name being 'Olympic Way' of course, as if you didn't know. I'll be using 'Wembley Way' and 'Olympic Way' interchangeably in this post.
Note: As this is a fairly long post, you may want to check out the videos first before going ahead, they're interesting.
Background
Lets start with a little background, about this little 600m (approx.) stretch of land from Wembley Park Station towards Wembley Stadium. Fans would know it as a pedestrianised easy access route towards the stadium. It never used to be that way. The Wembley Stadium area started to be formalised during the Empire Exhibitions of 1924, later being redeveloped for the 1948 Olympics. In fact, the famed route towards the stadium comes from the labour of German prisoners of war during this time, shocking, I know. It was re-built in 1948 during redevelopment work around the stadium to host the 1948 Olympics, hence the name 'Olympic Way'. The Wembley area, hasn't remained static, and over the years, it has evolved fairly consistently. It has been through several phases of development, and has also been fully pedestrianised, where at one time traffic used to be allowed. Today, the experience that unravels when walking along Olympic way towards the view that is presented of the centrepiece Stadium and it's iconic arch, is what makes the experience unique to Wembley, and one of the many reasons why this Stadium has become as recognisable a destination as it is.
The FA Cup Final, that's what we are here for. It's Arsenal vs. Aston Villa, the culmination of months of tournaments, the build up, the excitement, the emotions are all here to be displayed, with a few fans being asked to tone down by the police, and as the crowds arrive, just standing there, you can't help but be drawn into the build up. Fans, both of Arsenal, and Aston Villa, chanting, the Wembley chants. Oh my, it's exhilerating. Sadly, I'm not going to be in the Stadium, I'll be watching the crowds arrive, afterall, this is a blog about crowds, but it's hard for the excitement not to rub off on you.
Crowds Arriving
It's 3pm, as I arrive along Bridge road, as the name implies, is a bridge that stands over the station edge of Olympic Way, and gives a direct view of Olympic Way, with the Stadium in the distance. You can use the embedded google map above to zoom in, and see it from a satellite view. The fans are already arriving for the 5.30pm kick-off, and a constant stream of people arrive until kick-off time, with a few late ones running along the way. It's time for me to take some videos and photos of the crowds, as we shall see, it would be great to observe the behaviour as crowds arrive, the pedestrian traffic management employed by the police, as well as any other nuances that can be extracted from the crowd flow. We'll also observe the crowds leaving later on, don't worry.
Crowds Arriving along Olympic Way (View from Bridge Road)
As the trains arrive at the station, there's a surge of people arriving, walking down the stairs of the station, and along Olympic Way, it gets really busy, I mean really really busy. Here's a video below of what it looks like around 3.30pm to 4.05pm, that has been hyperlapsed.
Hyperlapse is a technique that takes into account both temporal and spatial features, so in a sense, it's a time-lapse with video stabilisation. I'm using Hyperlapse software by Microsoft Research, that approximates the user-specified video speed-up, and provides a smoothly moving camera. Useful, when you're recording by hand. As an aside, if you're interested in the background of how they're created, Microsoft are presenting a paper at SIGGRAPH 2015, as well as one they presented in 2014. In my case here, it really helps with the camera shakes as the videos were taken by hand.
Anyways, coming back to the actual video, the nice thing about the hyperlapse, is that it has the unintended consequence of slightly slowing down the video when there are abrupt changes in the crowd flow, such as bi-directional lanes forming, or changes in flow. There are several crowd phenomena that can be observed, especially as this is a fairly unique set of circumstances coming together, such as the culmination of an event, a direct route, a singular flow i.e. almost a procession along a very wide pavement, along with a very large number of people, given that Wembley Stadium has a 90,000 seating capacity. It makes it easier, to extract phenomena and behaviours in the crowd at individual stages. We will see how our individual decision making behaviours emerge, blending and transition into something bigger, than any one individual.
Emergent Behaviour
First of all, due to the unique set of circumstances, almost everyone in the crowd has similar sets of desires i.e. to start at Wembley Park Station, walk along Wembley Way, and enter the Stadium.
Due to the common set of desires, individuals tend to give up their decision making power, and lose their will to the will of the crowd, or as described by social psychologists, de-individuation, where one becomes part of the crowd, this is the nicer version, of the term mob mentality. There are several sub-processes that take place in the process of de-individuation and becoming part of the collective, that is, the crowd. Although, I've briefly explained some of the emergent behaviours in a previous post, I'm going to go into a bit more detail here, and also discuss it in the context of the crowds on Olympic Way.
Herding (Following)
As people arrive around 3pm, the crowd is fairly sparse, as shown in the beginning of the video, individuals have a much better view of the surroundings, they have an idea of their goal, and are able to take their own decisions of where to go. However, as time goes by and the density of the crowd starts to increase, it becomes difficult to be fully aware visually of what lies ahead of you, this is the first stage, and the clearest stage where one can actually observe how the behaviours transition from the individual to the crowd. As I mentioned earlier, a unique set of circumstances have come together, the fans in the crowd have a common goal, and as the density increases, the individuals will transfer control of their actions and behaviour over to others in the crowd, specifically to the person in front of them, if their destination lies in front of them, and in a similar direction. Aha, you say, yes, this event works really well for that, as the goal is Wembley Stadium, and it's a common goal in the same direction, although the eventual goal, is the goal of the football (bad joke!). Moving on, the passing and transfer of the decision-making to others and following their lead is termed as social contagion(see also here and here for more info). As you can see, each person in the crowd similarly starts to follow the individual in front of them that is travelling in a similar direction, leading to conformity. This conformity is termed as herding behaviour, which starts to emerge. In essence, we become a herd. Here, you're not making your own decisions anymore, and there's a bigger power that no one person is in control of, making these decisions for you. I know, we all like to be in control, but sadly, as much as we like to believe, we're in fact, not.
The Zipper-effect
We're done with herding, now what? Well, it's time to zip your jacket, no I'm not joking. What happens now is that, as the crowds arrive, the density increases, the herding behaviour is still in tow, where each person (or group of people) in the crowd, are following individuals in front of them. This herding behaviour leads to multiple layers of pedestrian flow forming, travelling in the same direction, and starting to cover the width of Olympic Way, as you see further into the video. These layers are compacted like a zip. Let me try and explain, the typical width of each layer, it has been noted, is approximately 45cm. However, the approximate width of a person is 55cm. What happens here is that, as each individual is fed through in a densely packed crowd, for example, if I were walking through the crowd, typically I wouldn't walk exactly behind the person in front, but in the middle of two people in front of me (presumably in order to see ahead, and fill the gap between the two people), the people behind me are doing the same, creating an almost zig-zag pattern, just like the layers of a zip, with me being one of the zipper teeth. Hence the term, the zipper-effect.
Lane Formation
Through the zipper-effect and herding, we lose control of our decision making, and put a lot of trust in the individuals in front of us in order to guide us, as the people in the video do. These zipped layers, lead to lanes forming that we wouldn't be fully aware of, whilst walking through the crowd. These lanes are not constant, but break and merge to adapt to the environment the crowd sees itself in. It may not seem completely obvious from the hyperlapsed videos, so I've also motion blurred time-lapse photos in the video below. You see how, there are several multiple layers of flows during the arrival of people walking along Wembley Way as they walk towards the stadium. The multiple layers are also known as stripe formation.
You can actually see the breaking and merging of these lanes in the motion-blurred video. During the 1 hour period, some fans stop to take pictures, as it's a good place to frame a shot with the Stadium in the back-drop. When these fans stop, within the motion-blurred video, they start to stand out. In the context of the crowd flow, they take the place of temporary obstacles. Now, in order to avoid the obstacles, some of the flow lanes break and merge, in order to navigate around the fans that play the role of temporary obstacles.
These standing people also have a secondary purpose, they actually funnel the crowd flow, although not necessary for the flow in this case, it actually helps to ease the pressure in the flow if it is building up, as it breaks up the flow. We'll see how this phenomena is used for a much more practical purpose, when the crowd are leaving.
Other Observations - Crowd Flow Control
In addition to the hand-held video shown earlier, I was able to use a DSLR on the railings (sadly my tripod turned out to be too short for the railings). Anyways, managing to take photographs over 1 hour at 2 second intervals, until kick-off time, the pictures have been cropped to focus on the police line, and have been stitched together in order to create a time-lapse video. However, the intervals didn't seem short enough, so it was necessary to motion-blur them, again to bring out features that wouldn't be too obvious otherwise. The video is still not very clear, as the upload caused a loss in quality, but hopefully it will work for now.
Police Spine Ramp Funnelling
The cropping has allowed the video to be zoomed in to observe the role of the police, as the crowd approaches the stadium, and the motion blurring help in extracting the changes in the flow. The line of police standing in the middle, serves an important purpose. As we all approach the stadium, it becomes exciting, or as some fans put it, the atmosphere is electric, the sign boards just above the police line display the direction to head towards based on the type of tickets purchased (as shown in the image below), in order to get to their respective seats. If there was no police line, the lane formation I described, will start to form, break and merge constantly, typically along the middle length-wise, as each of us try to go towards the ramp in the direction the sign boards direct us. This breaking and merging would increase the interaction between individuals as we tend to collide whilst trying to change directions, and in turn, the collisions start to slow the crowd.
The signs showing 'Aston Villa Collections' direction along the right ramp
The police line doesn't necessarily stop the crowd flow lanes from changing direction. However, the police line serves as a form of resistance to changes in the flow, and hence funnelling the crowd flow on each side of the line towards the ramps on their respective sides.
Why is the presence of the police line successful in creating a resistance, despite the gaps present for individuals to pass? Well, it's a cost / effort ratio. There are two conflicting sets of desires. We can see it from the individual point of view, as well as the flow point of view. As an individual in the crowd, say if I'm on the left side, I see the sign directs me to go towards the ramp on the opposite side (just as the Aston Villa sign in the image above does). I see the police line, and I see the direction of the crowd flow going in parallel to the police line. Is it worth trying to work my way through the crowd in order to get to the ramp on the other side in addition to getting through the additional narrow gaps created by the police line, against the momentum of the crowd flow that is leading me to the ramp on the left which will eventually get me to my seat anyway, probably not? Unless, I'm really determined, but what is the point?
From the crowd flow point of view, most individuals allowing the momentum of the crowd flow to direct them leads to parallel flow lanes appearing. In addition, the police line breaks the flow along it's width into two at the middle, leading to the flows on either side funnelling to the ramps on their respective sides. One point to notice though, is that the flow lanes near the police line have a smaller resistance due to the gaps in between the policeman. As those lanes don't need to fight against the other flow lanes, and where the gap between two individual policemen is greater (specifically in between two poles, the gap present between the last policeman and the pole), the effort required to change sides is much less than at any other point. The consequence is that you tend to see the flow lanes changing in these areas of broader gaps, which is not a big deal, where the important job of funnelling the crowd towards the two ramps, evenly distributing the crowd flow has been achieved.
Natural Crowd Surge Control
This is an interesting one. The crowd pressure is actually controlled, quite naturally. There are regular surges in the crowd flow at certain intervals coming from the station and going towards the stadium. Yes, you guessed it, controlled by the train timetable. As the trains arrive, the crowd flow surges, before dying down. These regular stop-gaps in the arrival helps in distributing and dispersing the crowd as they arrive, and it can be safely assumed that there won't be any unusual spikes in the crowd flow. This is really helpful in ensuring that pressure doesn't build up in the flow, helping to prevent any tragic events that have occurred in other situations, where other phenomena, such as Stop / Go Waves, and Turbulence can occur as pressure builds up (see here for more info). We'll see a similar stop-gap situation as crowds leave, but one that is artificially created.
During the FA Cup
Now that we've assessed and observed the crowds arriving, it was time to go to a bar in the Stadium retail area where I asked a friend to meet me, enjoy a beer, and watch the match from there. It was great even if it was just watching it from a bar, as you can actually hear the crowds roaring as goals are scored, well, mainly the Arsenal fans, as we know what happened. Well, during this one-sided match, as the last 10 mins approached with the score at 3-0 to Arsenal, it was time to leave, as I sensed that the Aston Villa fans would be leaving. As I was briskly walking along Olympic Way, becoming part of the crowd, following those in front of me and forming lanes (that I couldn't see), I heard another roar from the Stadium, as Arsenal put the final nail in the coffin with a 4-0 lead, and on their way to becoming the FA Cup Champions. If you want to watch the trials and tribulations of some fans, you can watch a BBC program 'Truly, Madly, Wembley' available on the iPlayer for another 6 days (UK viewers only, I'm afraid).
Crowds Departing
This time, as I approached Bridge Road, the stairs leading to Bridge Road were blocked off by the Police, so I had to go under it, and over to the other side, and get onto the road from the Wembley Park station area. The Police were standing on Bridge Road, so wouldn't allow me to take photos from the railings. Having to stand back and take the videos without any support, you can see the camera shaking as I get pretty tired towards the end. It's a video taken over approx. 90 mins. The hyperlapse video below has around a 20 min segment cut off from the middle, as it didn't show anything different to what can be seen.
Observations - Crowd Flow Control
Arsenal winning the match
In the video, as can be predicted, you see the Aston Villa fans leaving first. Until Arsenal lifts the FA cup within the stadium, the majority of
fans leaving are Aston Villa supporters, followed by a few spots of yellow
and red with Arsenal fans starting to leave, with the majority at the
end being Arsenal fans. In a sense, the events of the match has
implicitly controlled the departure of the crowd towards the station.
It's only a limited control, but helps, however, the
departure of fans is pretty constant, and as the match finishes, the
departure rate of the crowd can cause pressure to build up as they head
towards the station, with the rate of departure of the trains being slower than the rate at which the fans leave the stadium. There is no other natural stop-gap departure rate
that we had during the arrivals, such as the one provided by the train
timetables.
Stop / Go Simulation
Crowd management staff are therefore employed to control the crowd flow towards the station. They serve the purpose to control the crowd by employing Stop / Go signs. As Wembley Park station gets congested, the staff switch the 'Go' signs to 'Please Wait'. Hence simulating a stop-gap departure rate that provided natural crowd surge control, provided by the train timetable during arrivals earlier in the day.
Funnelling
There's a consequence of the crowd management staff regulating the crowd flow. They start providing a secondary purpose - funnelling the crowd flow. This funnelling actually helps in decreasing pressure in the flow, when the density is high, and could potentially help in an evacuation scenario. As it has been known to show that narrow obstacles can actually improve the flow at an exit by preventing pressure building up in a flow. I may be wrong, as it's not exactly an exit. The video above doesn't show the funnelling quite as well as another source I found from a reddit thread that I attach.
The video sourced from the redditt thread, shows a time lapse loop, with police horses in control of the crowd management, on different event.
Staircase blocking
Crowds tend to flow towards their destination, and try to find the path that requires the least amount of effort. Especially in our case here, everyone wants to go home, the match is over, and they want to get back home as quickly as possible. As pressure builds up along Olympic Way, the crowd flow will try to find other openings or gaps that would allow it to reach it's destination i.e Wembley Park Station. These gaps are the staircase that leads onto Bridge Road, and across towards Wembley Park Station. You can see the staircases on the right and further down on the left in the video (a google street view looking towards the station from Olympic Way with Bridge Road overhead has also been attached below). This has the potential to cause chaos on the road, as vehicular traffic tries to pass at the same time, causing traffic jams. Therefore, the police block these staircases, and form a path of resistance that doesn't allow the crowd onto the stairs, unless, some people get a bit unruly of course, then that resistance can break down. The crowd here were pretty well behaved.
Over the 90 mins, these four processes help a generally smooth exit for all the fans towards the Station and on their way home without any chaotic effects. The only downside is that they have to wait. Afterall, the Stadium has a 90,000 seating capacity, out of that say 80,000 were occupied, and another 20,000 to 30,000 went home by other means, that still leaves around 50,000 to 60,000 fans taking Olympic Way towards Wembley Park Station. Based on the capacity and safety measures taken, it's reasonable to wait 20 to 30 mins in order to get home safely.
The last trickle of fans leaving Wembley
The Analogy with Fluids
I've talked a lot about the crowds in terms of density, pressure and flow. It almost sounds like a fluid flow. Do crowds behave as fluids? Well, to a certain extent they do, however, humans are sentient beings, able to perceive and feel things. I talked about the properties of emergent behaviours, and how individuals transition from taking their own individual decisions to then passing on control to the flow of the crowd. The individual in the crowd is guided by many different desires and factors as well as the emotions that are brought out whilst in the crowd flow. They pass control, and they take back control depending on the situation that presents itself. We see how fans stopping to take pictures with Wembley Stadium in the back-drop in order to create memories that will last a lifetime. This ability to take our own decisions is where the analogy with fluids breaks down, where we stop being particles, and become human. We can try to look at a crowd flow as dispassionately as possible, however, there is still a human element to it, and we need to be aware of that. Every individual has a different history that guides them to do what they do, conflicting between wanting to be in control, standing out from the crowd, and being part of the collective. This is what makes predicting crowd movement such a difficult problem, and so difficult to simulate. However, simulation is a simplification of reality, and if we try to draw an analogy with fluids being aware of the limitations, we can use it to a certain extent in addition to other techniques to predict the flow and movement of crowds.
Self-organising Behaviour
There's another phenomena I want to discuss. Looking at crowds with a naiive eye makes it look rather chaotic, or we can replace it with the word 'complex'. I've talked about emergent behaviours within a crowd, where the individual behaviours lead to a collective crowd flow. This transition between the individual person to a collective flow pattern, transitioning from herding to zipping to lane formation and back to the individual, with lanes forming and merging, and the crowd trying to fill gaps in its route with the minimum effort sounds like a 'system' doesn't it, where if you think about it, the flow is fairly well organised, without having to control it much. Just ensuring it's guided in the right way as the police and crowd management staff do, the crowd flow will form naturally without much effort, self organising itself for the situation that is presented. This leads us to observe that complex individual behaviours driven by the human mind leads to a system that self organises itself given the environmental / urban sitation at hand. Something that we can now call, 'a complex system'. Isn't that interesting?
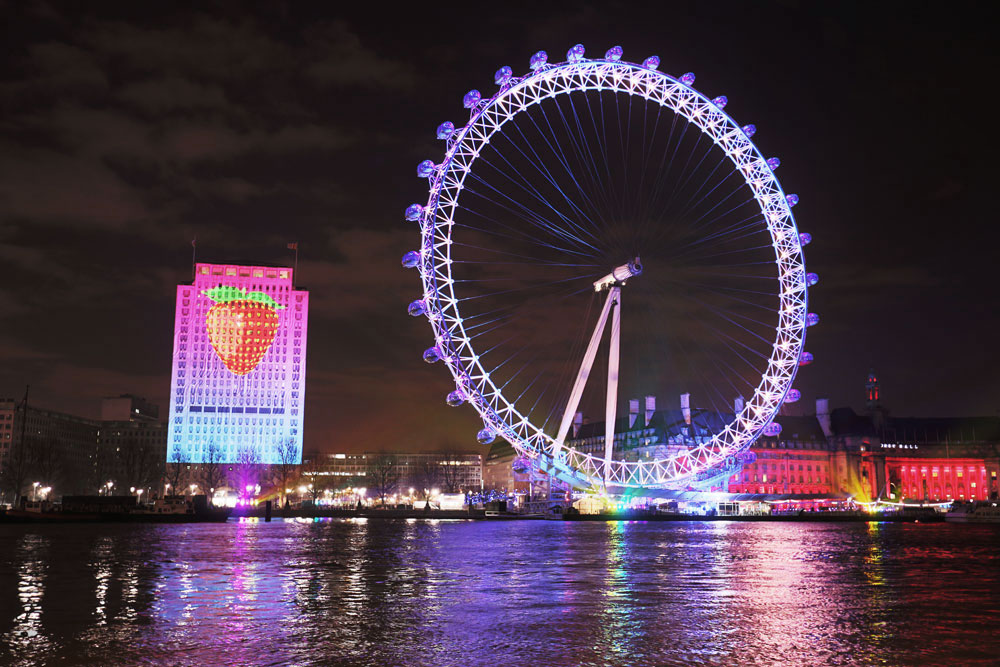
Everyone is getting ready for New Years celebrations, I for one go to see the London Eye Fireworks almost every year. However, as the Mayor has decided to charge £10 to see the fireworks and the requirement of buying it in advance has put me off this year. No doubt I will still be watching it, albeit from a distance. However, if you're one of those lucky ones that have managed to purchase a ticket, and are looking forward to the fireworks, trust me, it's quite a view, and if you go in early enough, you'll get a good spot, when I say early, it's about 8pm. Especially the embankment area, it gets cordoned off after that (well, used to until they started charging), so the number of people is just about right.
The atmosphere is great with everyone in a celebratory mood, London turns into this extremely friendly place, where one feels part of this huge family that has come together to celebrate bringing in the New Year. You get to meet all sorts of people from around the World. When the countdown begins, there's a massive display on the Shell Tower block counting down the seconds until Big Ben strikes midnight, the lights around the London Eye start flashing, and off with a bang go the fireworks timed with music blurring through the speakers along the embankment. The pictures show last year's theme.
Sweet Flavoured theme in 2014
London Eye Fireworks 2014
However, once the fireworks and celebrations are over, you need to head back home or to another party, this is when it becomes a little difficult. The crowd, oh my, the crowd, if you've had a good spot on the embankment, it can take an hour or more to get to the exit at Trafalgar Square along Whitehall due to the number of people trying to get to the stations and back to wherever they want to go. The police generally use a pedestrian traffic management system allowing a certain number of people along Whitehall at a time with a number of break spots. There is also a final barrier at the end of WhiteHall into Trafalgar Square, where people can only exit from the middle of the barrier. The typical route one would take through the crowd to exit from a spot on the embankment is shown in the top map illustration. What happens here though is that you want to get out the quickest way possible, and instinct dictates that you take the shortest route through the crowd, which is through the middle of the crowd flow, where everyone is walking through and you follow the person in front, due to the herding effect, as I explained in my previous post. This is shown in the first picture. However, we don't want to use instincts here, we want to use a better approach to getting through and exiting as quickly as possible. How do we do that?
Typical exit route from the embankment
Exit route skirting the crowd flow (map via Open Street Maps)
We go against our instinct of getting through the dense crowd in the quickest possible way, that is, walking through the middle. Now that most people will be walking through the middle, what we want to do is look at the crowd flow, as long as it's a homogeneous flow, the density of the crowd is the greatest at the middle, so we want to avoid that area, and walk in the areas of least density that is moving in the direction of our exit. The area of least density in our case is the edge of the crowd flow, so as long you skirt the edge of the crowd flow, you will get through to the exit in the quickest possible way. It's only a small change from your typical way of walking in a crowd, just stick to it, and don't let your instincts take over, especially at the end point when you see the barriers, walk around it as shown in the figure. From personal experience, I got through the crowd with my friends to the exit in a little less than half an hour last year. Although I'm aware of this solution as part of my research, I still couldn't help my instincts telling me to go through the middle as well, especially when we were so close to the exit barriers, so it's an innate human trait I suppose, but I had to fight it off. There you go, a simple and effective way that not only works on New Years Day, but in other situations of dense crowds flowing in a homogeneous manner.
Now, hope you all have a really great New Year Celebrations, and hope the New Year is filled with joy and happiness.
Boxing Day is a great day to go shopping, you can grab yourself bargains that you could not grab throughout the year, navigating your way through the thousands of bargain shoppers. A few years ago, I decided to brave Boxing Day shopping and became one of those bargain shoppers on a mission, on the most crowded shopping street in Europe, Oxford Street is what I'm talking about. The street that all Londoners try to avoid until hell freezes over, well, not quite, but you know what I mean, if you want to avoid crowds even on a normal day, you avoid Oxford Street.
Boxing Day 2011, Oxford Street
Boxing Day is a whole other occasion. It's an interesting place on Boxing Day, especially if you go in with a determined focus, you can get out of it unscathed by the evening, with bags full of things that you don't really need, but you just end up buying (I'll let other experts explain that behaviour: here and here).
If you just take a step back, and look around at what is happening, people start flocking to shops to spot bargains. In order to get to these shops, they navigate the thousands and thousands of people on the street. You have a shop (or many shops) in mind, and you want to get to each shop as quickly as possible so that you don't miss out on those bargains of the year. In order to get to the next shop in the quickest possible way in a crowd, you start mimicking behavour, humans are indeed great social creatures that navigate the social world through mimicry. We like to copy others, in order to be socially accepted, and at the same time, we like forming our own unique identity, and we work by balancing these conflicting interests.
In this context, we find ourselves mimicking each other whilst navigating crowds. Due to the sheer number of people in our path, we can't normally see our destination clearly, but we know the direction we want to go. For example, I want to walk to Selfridges through the Boxing Day crowds to grab that sought after bargain (yes, that's where we all want to go on Boxing Day, considering they had an estimated turnover of £2 million in one hour yesterday). How do I get there?
First of all, I can't see my way due to the amount of people present, so I observe the person walking in front of me going in the direction of Selfridges, and I start following them. What I'm actually doing here is I'm passing my decision making power to the person in front as I can't see the path, and I'm trusting that person to take me in the direction I want as quickly as possible through the crowd. There is a term for this kind of following behaviour, known as herding. This is the first step I take in order to get me to my bargain. The transfer of power itself is known as social contagion.
Now, if I take a step back (not literally), and look around, I start to
see every one of us is following a person in front of us in order to
help us get through the crowd. The herding behaviour leads to multiple layers of people flow
forming travelling in the same direction, especially due to the number of people on the street. We can look at this from an analogy of car traffic on a motorway. On a motorway
junction, before entering the motorway, at the slip road, two roads
merge into one. Similar merging happens when I'm walking through the crowd, the merging of people travelling in the same
direction. This gives rise to our second phenomenon, known as the zipper effect . It's pretty much like zipping your jacket, where each zipper tooth is layered over the other, similarly you're the zipper tooth, and you start zipping against other pedestrians travelling in the same direction.
There's a lot of trust we put in the
person in front to get us to our destination. This trust we put in each other leads to our third phenomenon, the emergence of lanes formed of the 'zipped' multiple layers through the crowd. These lanes can be in both directions, and there may be more than two lanes at the same time. Due to the herding behaviour, these lanes generally become homogeneous, and we are unconsciously giving up a part of our identity to become part of this homogeneous flow. This may or may not seem obvious, but the observance, and dissection of these individual steps that lead to these phenomena help us explain the way crowds behave. How we transfer our own identity to the identity of the crowd, leading to the emergence and disappearance of flows and lanes, gives us an understanding of our own identity within a crowd. There is also a term for these types of flows, not a creative name, but one that makes the meaning clear, it's known as lane formation. These lanes are ever changing, and they adapt to people in the crowd just standing, the existence of bus stops, street lamps, etc.
along the street. It's interesting to see how we as people are adaptable, and this adaptability also works really well at a macro-scale, the flow lanes adapting to the environment present to us.
Being a part of these lanes, and flowing amongst it then gets me close to my destination, that is Selfridges. This gives me the flexibility to again take control of my decision making and I walk towards it and enter this multi-million pound department store in order to grab that well sought after bargain. Before I know it though, I've again passed part of my decision making to the marketers that get me to buy items that I don't really need. Again, I leave that to the other experts I've linked to, to explain how that's done.
Boxing Day 2011, Oxford Street (showing the emergence of Lanes)
Why am I talking about this? Well, in addition to the fact that this is a blog on crowd simulation and to understand how crowds form and behave, it was one of those things, where I was walking along Oxford Street on Boxing Day a few years ago, I decided to take a picture of the crowd at the time and post it on one of our current social media platforms. However, observing the photo closer, you start to distinguish the lanes
that have formed through the crowds, which I thought was quite
interesting to observe in my natural environment outside my normal
research realm. As you can see with the photo overlaid with the lanes. Also, the current timing seemed quite fitting, as I decided I didn't want to brave it again this year.
Other than that, hope you've all had a great Christmas, have a better understanding of what you do when you go out shopping on Boxing Day, but most importantly, found yourselves some good bargains that you actually do need.
This post is slightly off-topic, but when developing it's important that software development needs to be managed on an ongoing basis. One of the best ways to do this is by using version control.
Version control, briefly explained, is the management of changes to documents, computer source or anything that has large collections of information. Version control systems take snapshots of these collections, and any changes to these can be tracked. In terms of software engineering, revision control takes the form of keeping a track of source code, which is my focus when developing my model.
There are three popular version control systems, git, mercurial and subversion. I'm not going to dwell on comparing these. If you need more information on these, just click on the links. Personally, I use git for my version control purposes. What I want to focus on is managing the snapshots. Taking snapshots regularly will allow us to save every change that has happened, but how do you keep track of these changes once your software system grows. What can be done to save the feeling of despair further on in the software development process when the tracking of changes potentially becomes unmanageable.
Here's a good guideline for version control written by Tom Proston-Werner, who is the co-founder of GitHub. He calls it "Semantic Versioning", which provides a simple, yet efficient set of rules and requirements to state how version numbers are assigned. The full post is here, for further details on these guidelines. Quoting from the post directly:
Given a version number MAJOR.MINOR.PATCH, increment the:
MAJOR version when you make incompatible API changes
MINOR version when you add functionality in a backwards-compatible manner, and
PATCH version when you make backwards-compatible bug fixes.
These simple set of rules makes is really easy to see when you've added different types of changes to your source code and go back and forth between them, if necessary. This works for collaborations, or individual development in my opinion.